When you open Flowis, the first page you see is a Dashboard with the information you want to have at hand for the Users. Dashboards can contain various widgets and each of them can show different kinds of information. You can set up more Dashboards than just one – Users can navigate between them in the left menu, under “Dashboards”.

Creating Dashboards
If you want to add a new one or edit an existing Dashboard, click your profile picture in the top right corner and select “Manage dashboards”.

Here you need to set up:
- Name – name of the Dashboard, will be shown in the left menu to the Users
- Description – internal description of the Dashboard
- Sharing groups – here selected Groups will have access to see the Dashboard. If no Group is selected, all of the Groups will have access to this Dashboard
- Managing groups – here selected Groups will have access to edit or delete the Dashboard. If no Group is selected, all of the Groups will have access to manage this Dashboard
- Default? – default Dashboard will be opened every time when opening Flowis as the home page
- Dashboard location
- Dashboards – will be located in the left menu under “Dashboards”
- Transaction detail – will be located directly in Transactions, in a new tab
- Widgets – create all the widgets that should be part of the Dashboard. Read further to learn about the different widget types
- Layout – change the size and arrangement of widgets using drag & drop to create the desired layout of your Dashboard
Creating widgets for Dashboards
- Name – will be shown at the top of the widget
- Dashboard – on which Dashboard should the widget appear
- Widget type – what kind of information should be shown on the widget
- Actions chart – chart of filtered actions (logs, change of details on transactions, comments…)
- Actions pivot table – pivot table of filtered actions
- Definitions chart – chart of filtered definition records
- Definitions pivot table – pivot table of filtered definition records
- KPI pivot table – pivot table that calculates the duration between two actions
- Text box (ERB) – text box that uses ERB for formatting. This widget type can be used to add files to your Dashboard, but please, contact your IT administrator to arrange this
- Text box (WYSIWYG) – text box with Froala editor for formatting (WYSIWYG – What You See Is What You Get)
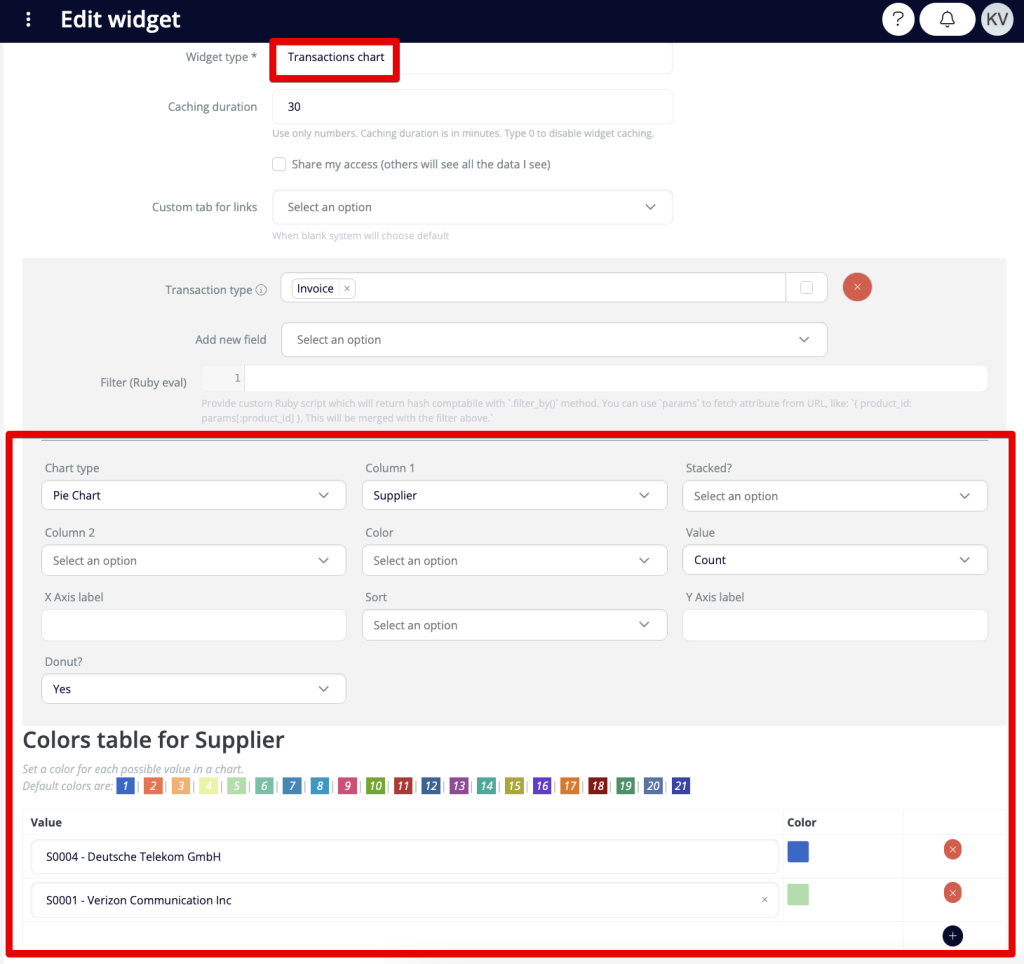
- Transactions chart – chart of filtered transactions
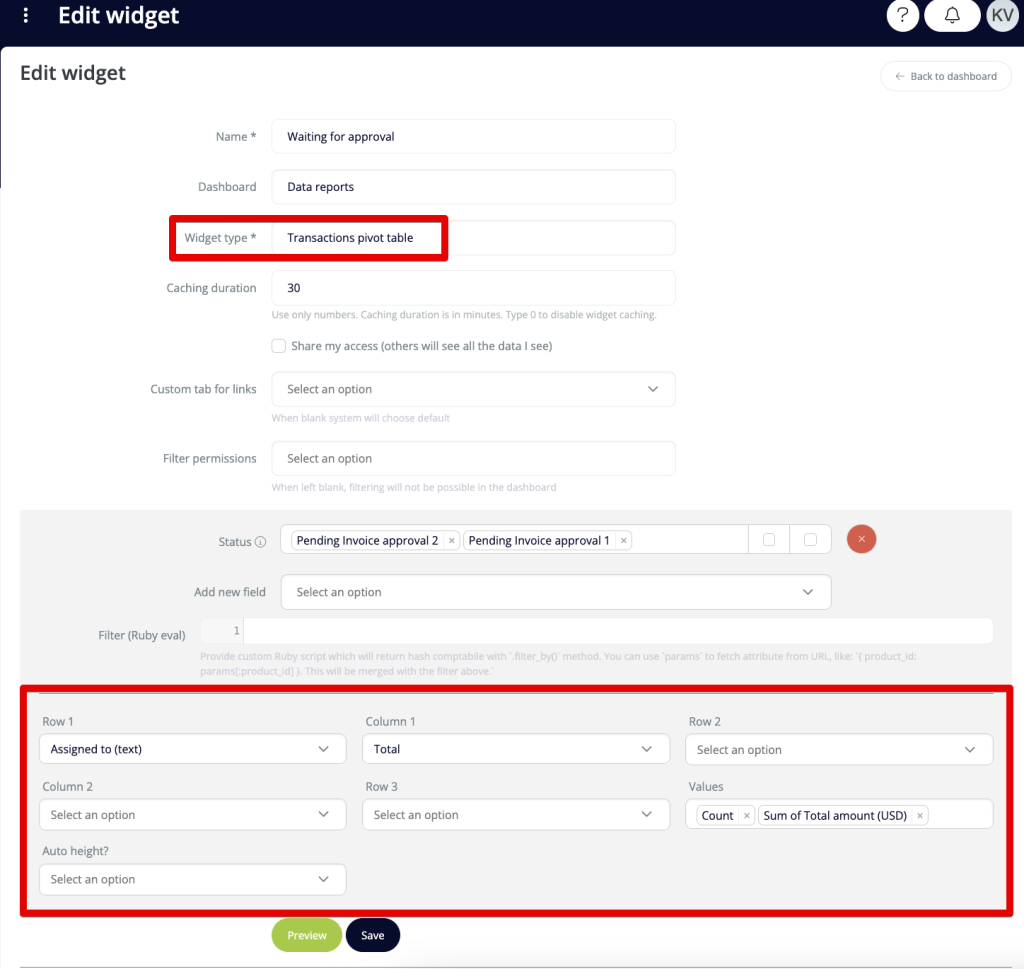
- Transactions pivot table – pivot table of filtered transactions
- Caching duration – time (in minutes) when the Dashboards will reload the data (e.g. every 5 minutes, every 30 minutes, every 0 minutes = the data will be reloaded every time you open the Dashboard)
- Share my access – others will see all the data you see
- Filter permissions – available for pivot table widget types, select corresponding Filter permissions to let Users filter data how they need
- Definition model – available for definitions widget types, select the corresponding Definition that contains data you want to use in this widget

Chart widgets
On the very bottom of the screen, you can select the chart type and set the columns, colors, labels, sorting, etc. for your chart. It is always important to fill in the “Value” field.
Pivot table widgets
On the very bottom, you can find options to select which data should be contained in each row and column to create your pivot table. It is always important to fill the “Values” field.